
Page 49 - Genetics_From_Genes_to_Genomes_6th_FULL_Part3
P. 49
10.1 Finding the Genes in Genomes 343
Finding conserved DNA sequences The landscape of DNA sequence conservation
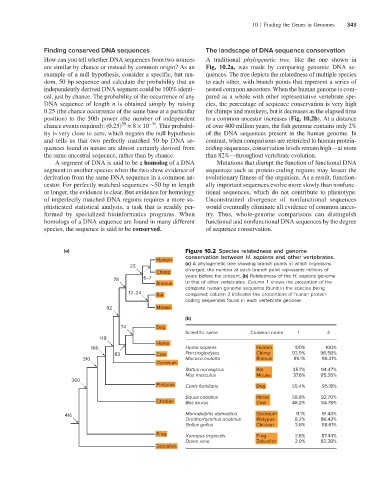
How can you tell whether DNA sequences from two sources A traditional phylogenetic tree, like the one shown in
are similar by chance or instead by common origin? As an Fig. 10.2a, was made by comparing genomic DNA se-
example of a null hypothesis, consider a specific, but ran- quences. The tree depicts the relatedness of multiple species
dom, 50 bp sequence and calculate the probability that an to each other, with branch points that represent a series of
independently derived DNA segment could be 100% identi- nested common ancestors. When the human genome is com-
cal, just by chance. The probability of the occurrence of any pared as a whole with other representative vertebrate spe-
DNA sequence of length n is obtained simply by raising cies, the percentage of sequence conservation is very high
0.25 (the chance occurrence of the same base at a particular for chimps and monkeys, but it decreases as the elapsed time
position) to the 50th power (the number of independent to a common ancestor increases (Fig. 10.2b). At a distance
50
chance events required): (0.25) = 8 × 10 −31 . This probabil- of over 400 million years, the fish genome contains only 2%
ity is very close to zero, which negates the null hypothesis of the DNA sequences present in the human genome. In
and tells us that two perfectly matched 50 bp DNA se- contrast, when comparisons are restricted to human protein-
quences found in nature are almost certainly derived from coding sequences, conservation levels remain high—at more
the same ancestral sequence, rather than by chance. than 82%—throughout vertebrate evolution.
A segment of DNA is said to be a homolog of a DNA Mutations that disrupt the function of functional DNA
segment in another species when the two show evidence of sequences such as protein-coding regions may lessen the
derivation from the same DNA sequence in a common an- evolutionary fitness of the organism. As a result, function-
cestor. For perfectly matched sequences ∼50 bp in length ally important sequences evolve more slowly than nonfunc-
or longer, the evidence is clear. But evidence for homology tional sequences, which do not contribute to phenotype.
of imperfectly matched DNA regions requires a more so- Unconstrained divergence of nonfunctional sequences
phisticated statistical analysis, a task that is readily per- would eventually eliminate all evidence of common ances-
formed by specialized bioinformatics programs. When try. Thus, whole-genome comparisons can distinguish
homologs of a DNA sequence are found in many different functional and nonfunctional DNA sequences by the degree
species, the sequence is said to be conserved. of sequence conservation.
(a) Figure 10.2 Species relatedness and genome
conservation between H. sapiens and other vertebrates.
Human
25 (a) A phylogenetic tree showing branch points at which organisms
Chimp diverged; the number at each branch point represents millions of
75 6–7 years before the present. (b) Relatedness of the H. sapiens genome
Rhesus to that of other vertebrates. Column 1 shows the proportion of the
complete human genome sequence found in the species being
12–24 Rat compared; column 2 indicates the proportions of human protein-
coding sequences found in each vertebrate genome.
92 Mouse
(b)
74 Dog
Scientific name Common name 1 2
148
Horse
166 Homo sapiens Human 100% 100%
83 Cow Pan troglodytes Chimp 93.9% 96.58%
310 Macaca mulatta Rhesus 85.1% 96.31%
Opossum
Rattus norvegicus Rat 35.7% 94.47%
Mus musculus Mouse 37.6% 95.36%
360
Platypus Canis familiaris Dog 55.4% 95.18%
Equus caballus Horse 58.8% 92.70%
Chicken Bos taurus Cow 48.2% 94.78%
416 Monodelphis domestica Opossum 11.1% 91.43%
Ornithorhynchus anatinus Platypus 8.2% 86.43%
Gallus gallus Chicken 3.8% 88.61%
Frog Xenopus tropicalls Frog 2.6% 87.44%
Danio rerio Zebrafish 2.0% 82.38%
Zebrafish